

Before we go out and ride we like to review the trails on a recent satellite image. This can provide some useful hints before the trip about changes to the trails, such as overgrown paths, trails affected by landslide, the water depth of a river crossing, or recent constructions on and around the trails we ride. This requires high quality satellite imagery, experienced interpretation and a little bit of luck. In this guide I show how I usually approach this and provide some tips how to view satellite imagery with either Google Earth or Google MyMaps, create tracks and waypoints and download and share the track file. Both application have very similar functionalities, but differ slightly in features and use. In the end it comes down to preference, but they are both free to use so you can give both a try and decide which one is the better fit for you. I end up using MyMaps more often for the faster loading speed and better sharing features, and use Earth when I need more detailed satellite images.
Related: Check out our Comprehensive Guide on Off-Road Motorcycle Navigation where we cover all topics from planning to execution.
Table of Contents
Google MyMaps
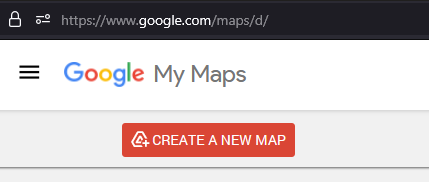
Go to https://www.google.com/maps/d/ and create a new map by clicking “create a new map”.
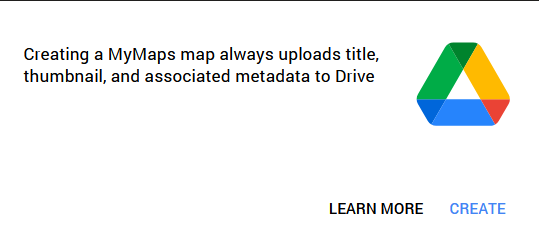
Make sure that you are logged in with your Google acocunt, because the map will be saved to Google Drive, confirm by clicking “create”.
Your newly created map will open.
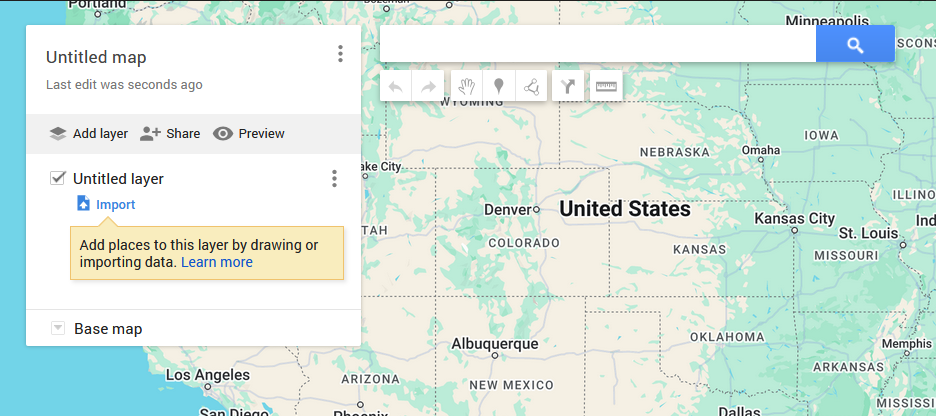
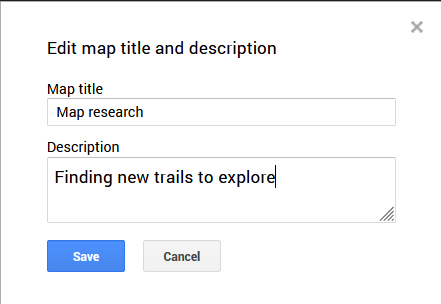
You can give it an appropriate name by clicking on the map title, if you skip this step, it will be saved as “Untitled map”.
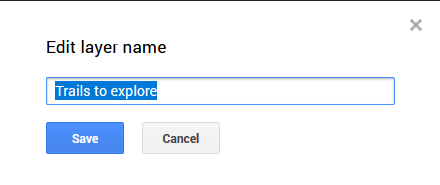
When a new map is created, there is automatically one layer created with the name “Untitled layer”, we edit the name to “Trails to explore” and hit save.
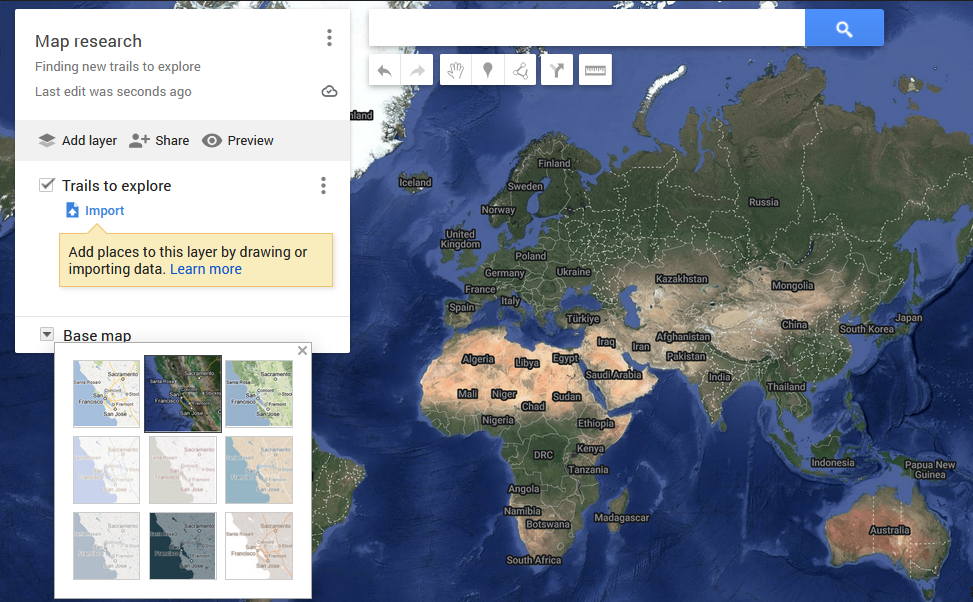
Next we change the map view to satellite image by clicking on Base map > Satellite.
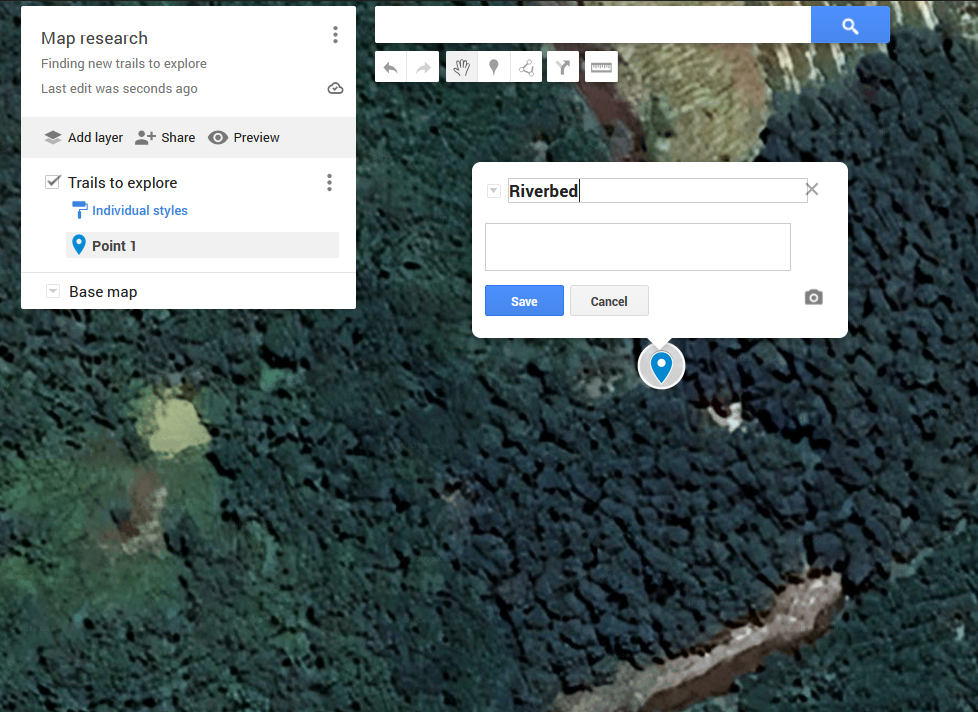
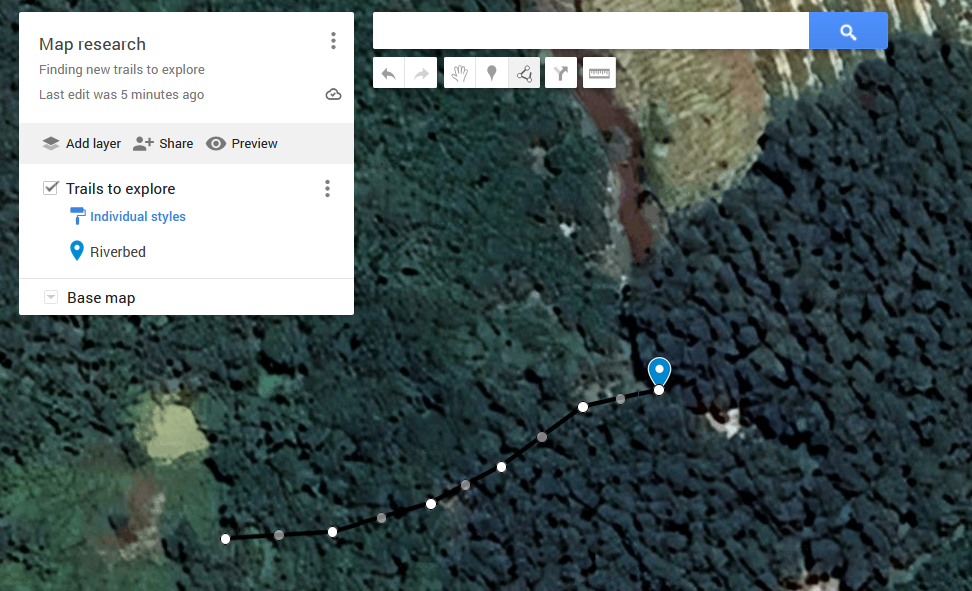
Now we go to the area we want to explore, in our example this will be a remote trail at a riverbed in south Vietnam. To save this location we click on the little Waypoint symbol below the search bar and we name this Waypoint “Riverbed”.
We notice immediately that the trail around this area is not easily visible with the satellite image on Google MyMaps, in this case it might be a good idea to switch to Google Earth to continue scouting the area since it provides further functions for satellite imagery. (Go to Google Earth section)
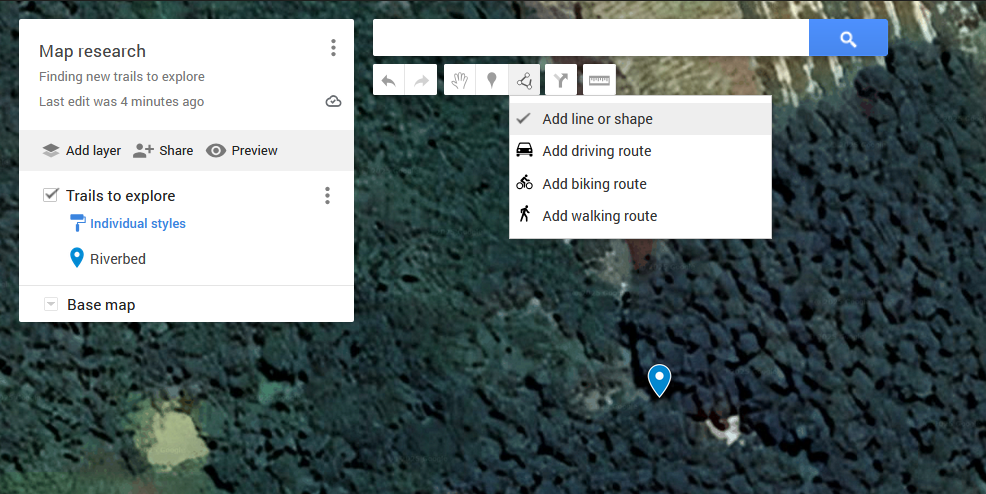
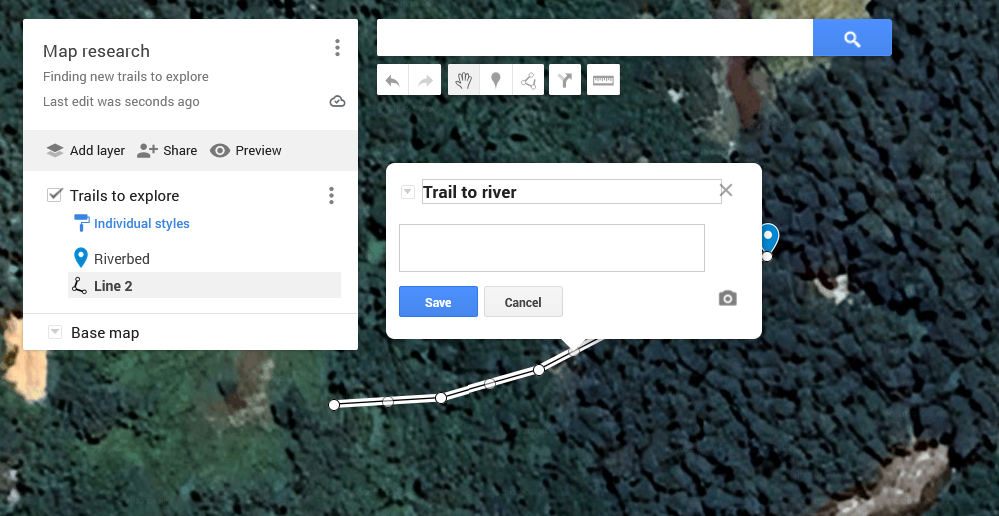
In order to create a track in this area, we click on the “Draw a line” symbol on the right next to the Waypoint symbol, and select “Add line or shape”.
Now I can connect waypoints to create a track. Remember, a track is nothing fancier than breadcrumbs aka waypoints connected with a line to improve readability. The accuracy increases with the density of the waypoints on my track, but increases also the file size, because more coordinates are being stored.
When I finished drawing my track, I hit the “enter” button on my keyboard and confirm by providing a track title.
Now that I have a map, a waypoint and a track I can either download this track to use it in another application, e.g. on my navigation device, or share it with someone with google’s in-built sharing function.
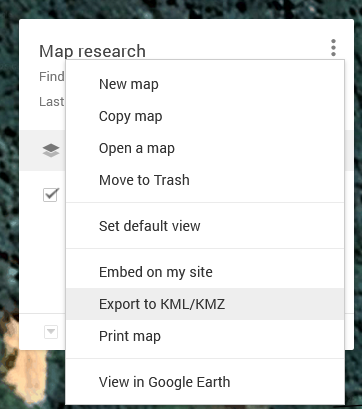
To download, I click on the three dots next to the map title and select Export to KML/KMZ.
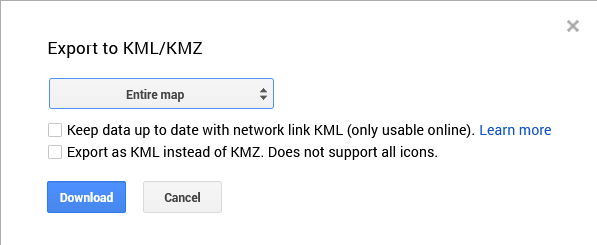
In the next windows I am being asked if I want to download the entire map, or individual layers. In my example we only have one layer, so the result will be the same. In this pop-up I can also choose to keep it linked to the network, but in most cases we want to generate an offline file so we do not check this box. By default, it will generate a KML (Keyhole Markup Language), Google’s archiving format for geographic data. If we wish to export as KMZ, which is a compressed version of KML we can check the second box. I only recommend this if the file is very large.
By clicking the “Share” button beneath the map title, we can conveniently share the map with others. This is especially helpful when planning a group ride to share the trails upfront so everyone can download it and import it on their navigation device.
Hint: When opening the shared link on a smartphone, it will by default open it on the Google Maps application, on which it can show the tracks and waypoints, but is not downloadable. If you want to download it on a mobile device, make sure you open the link in a browser, only then you will see the three dot menu and see the “Download KML” selection as we did before.
Google Earth
Now we will move on to Google Earth which is more rich in features when it comes to satellite imagery.
We head to https://earth.google.com/web to open the web application. On this screen we can see all our existing projects.
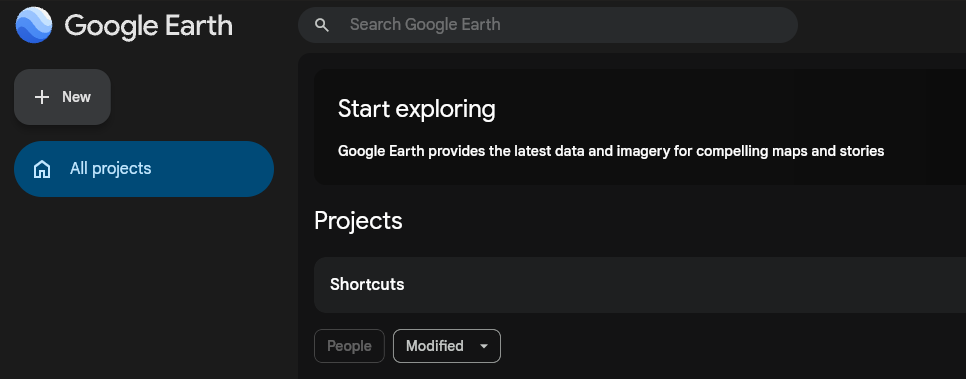
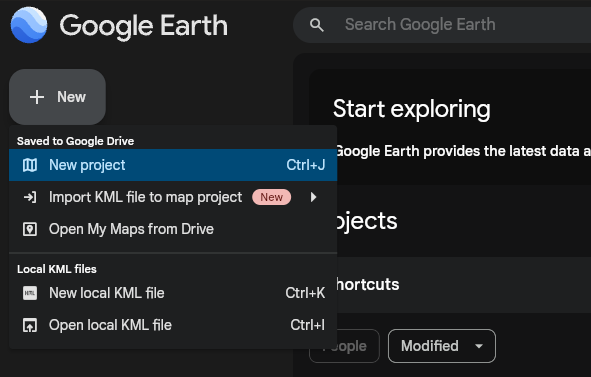
When starting a new project, we have the option to create a new project from scratch “New project”, import KML from Google Drive, or from a local file. In this case we create a new project from scratch.
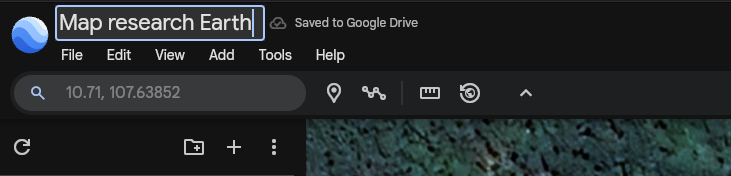
I rename the project by clicking on the title. Note that it is automatically saved to your Google Drive.
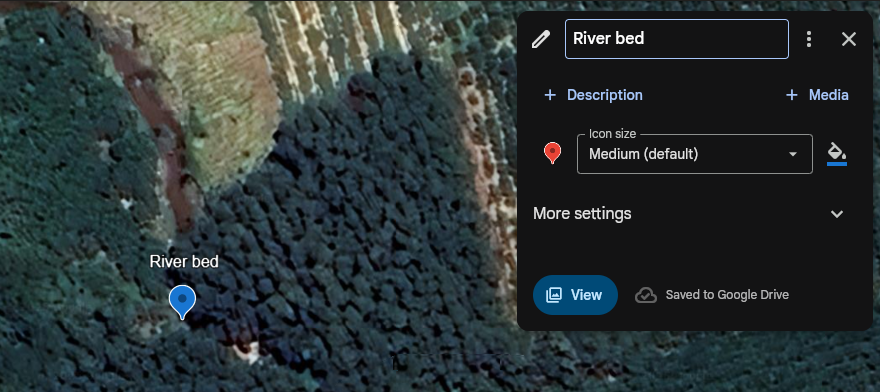
We now again go to the same river bed as we did on MyMaps and place a waypoint to save the location.
Now we want to use Earth’s extended satellite imagery features, and one function I especially like to use is the historical imagery. With this feature I can see satellite images from the past and see how things have changed.
To activate historical imagery I can use the menu View > Show historical imagery, or use the keyboard shortcut CTR+H. A bar will appear above of my map on which I can go back and forth on the timeline.

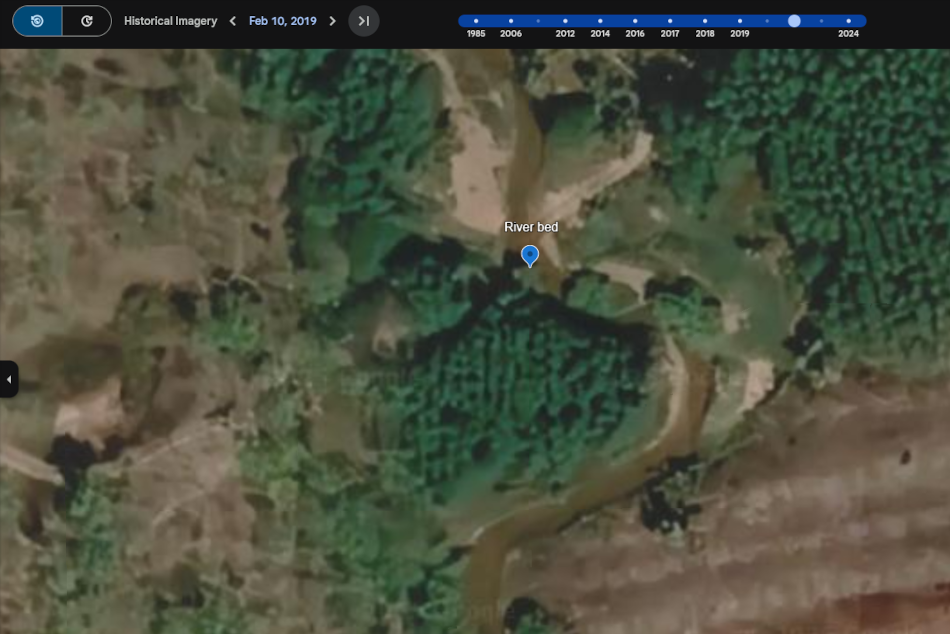
Now I see from what date the latest image is, in this case it is October 2024. Since the area I am viewing is south Vietnam, it is important to understand how the vegetation and environment is affected by seasons. South Vietnam has two seasons, the dry season which lasts from November to April, and the wet season from May to October. This image is therefore created at the end of the wet season, which means it has been raining almost non-stop for the last six months when the image was created. Which means a lot of vegetation has formed, and rivers are filled to the top with water. Usually, the more vegetation the less visible are the trails. So what I like to do is to go backwards until I find a date that shows an image during a time when trails are easier to see, this is usually true in the time from February to April. Unfortunately this particular area has not received many updates, so the second recent shot I get is from February 2019, which is more than six years apart, but at least I can see it in a different season.
Below you can see the difference between the two satellite images.
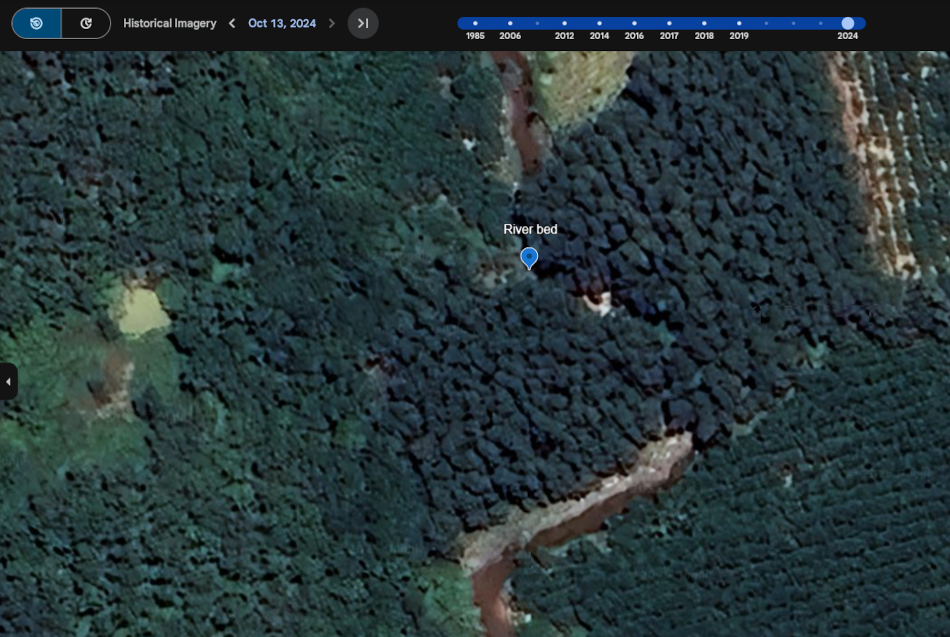
On the February version the trail becomes much more visible.
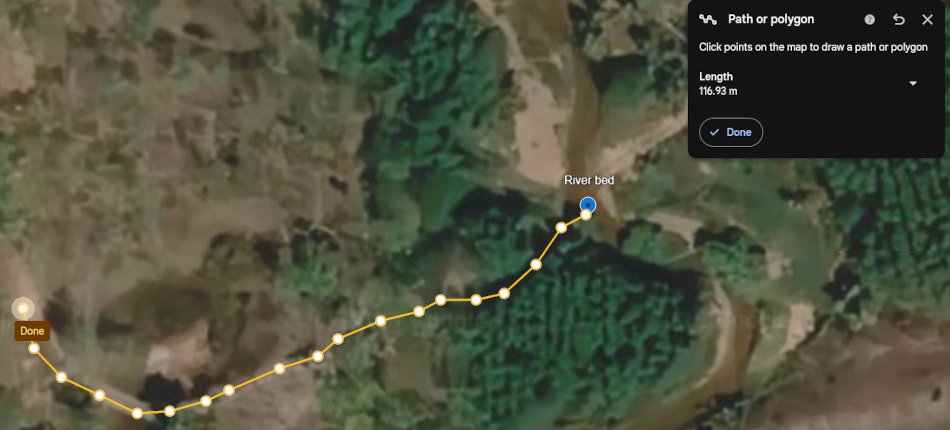
Since it is now easier to see where the trail goes, it will be much easier to draw an accurate track line. By using the “Add path or polygon” tool in Earth I can draw my track and save by clicking “Done” when finished.
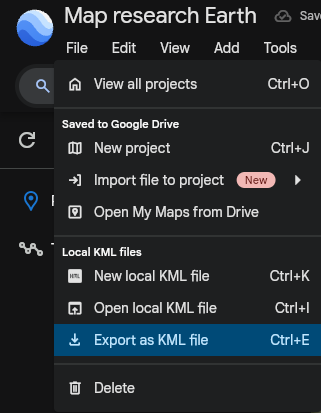
Finally, I can similar to MyMaps either export the KML file under File > Export as KML file, or by using the shortcut CTRL+E. There is also a share function on the top right of the screen to share a link of the created map with others.
To use the exported KML file with a GPS device such as the Garmin Montana you will most likely need to convert it into a GPX format, I will soon have another guide where I explain in detail how to convert a KML file into a GPS friendly GPX file, how to edit tracks and import it to the GPS device. Stay tuned!
Bonus content
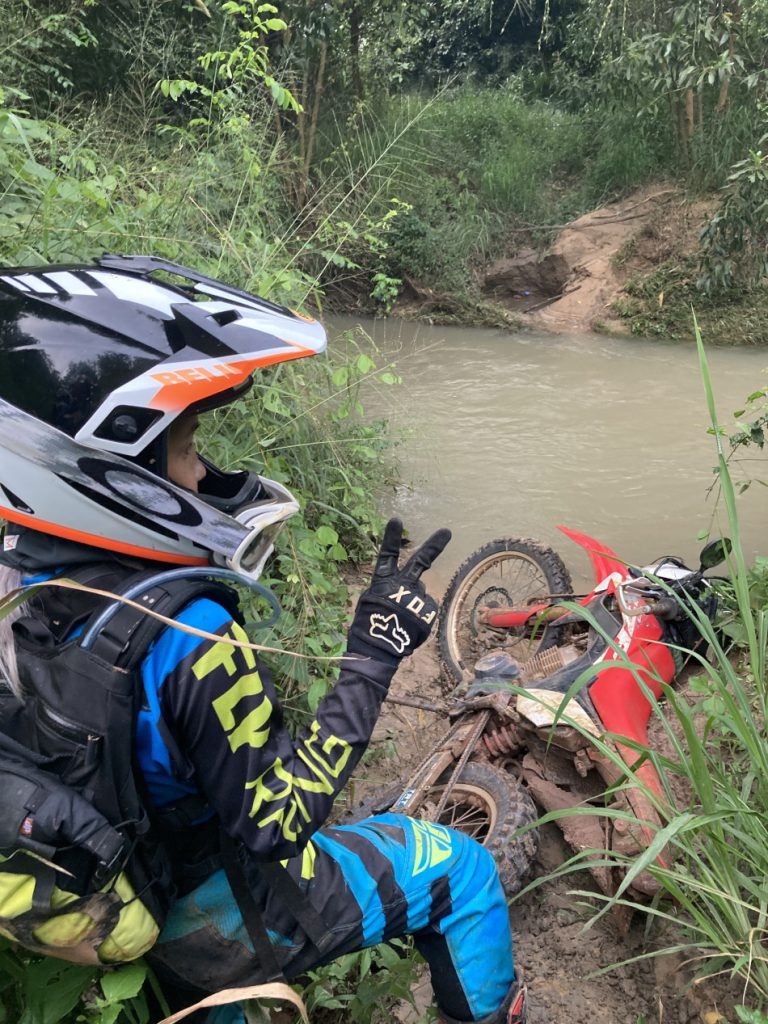
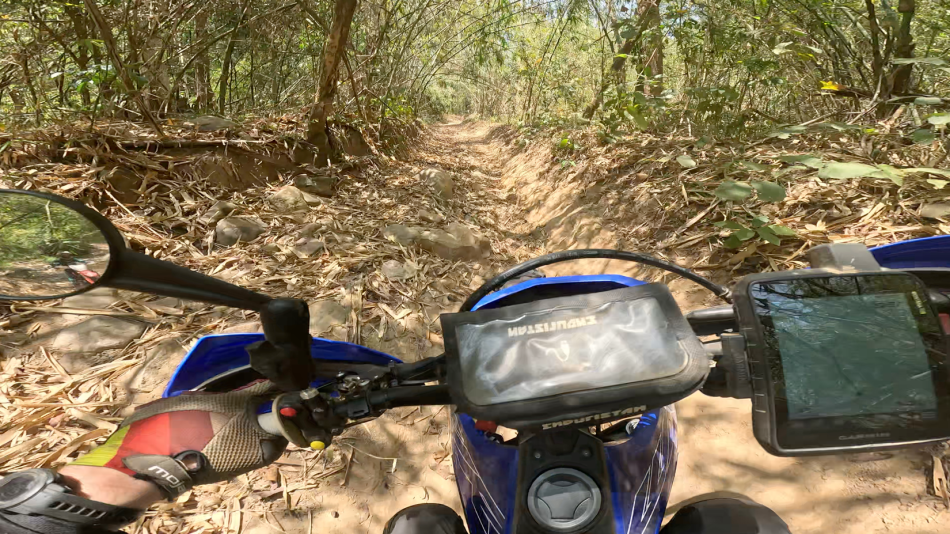
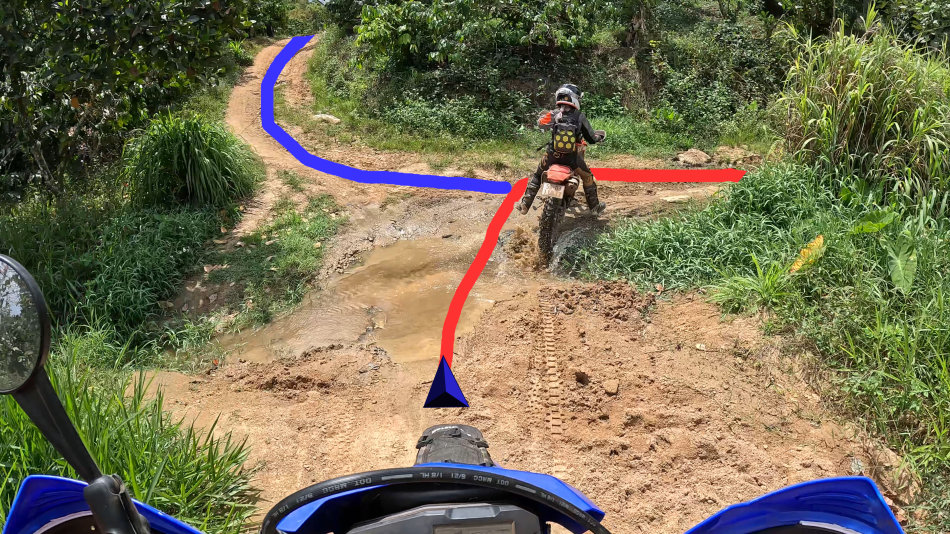
Now if you are wondering how this river crossing looks like in “live”, here are some pictures from our rides.
This picture was taken in August, and the water was so high and the current so strong that we couldn’t cross and had to turn around.
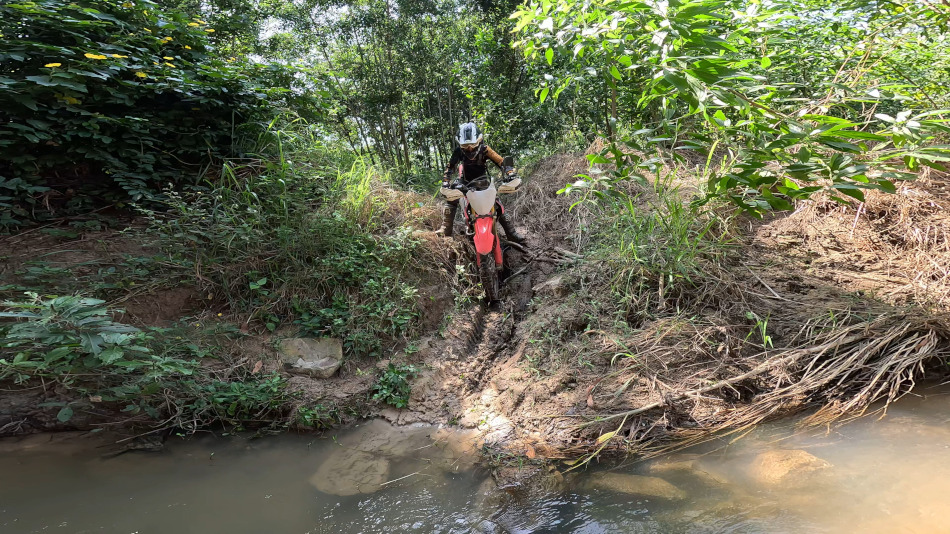
The following picture is from November when the water was quite low due to less rain in this season and we were able to cross.
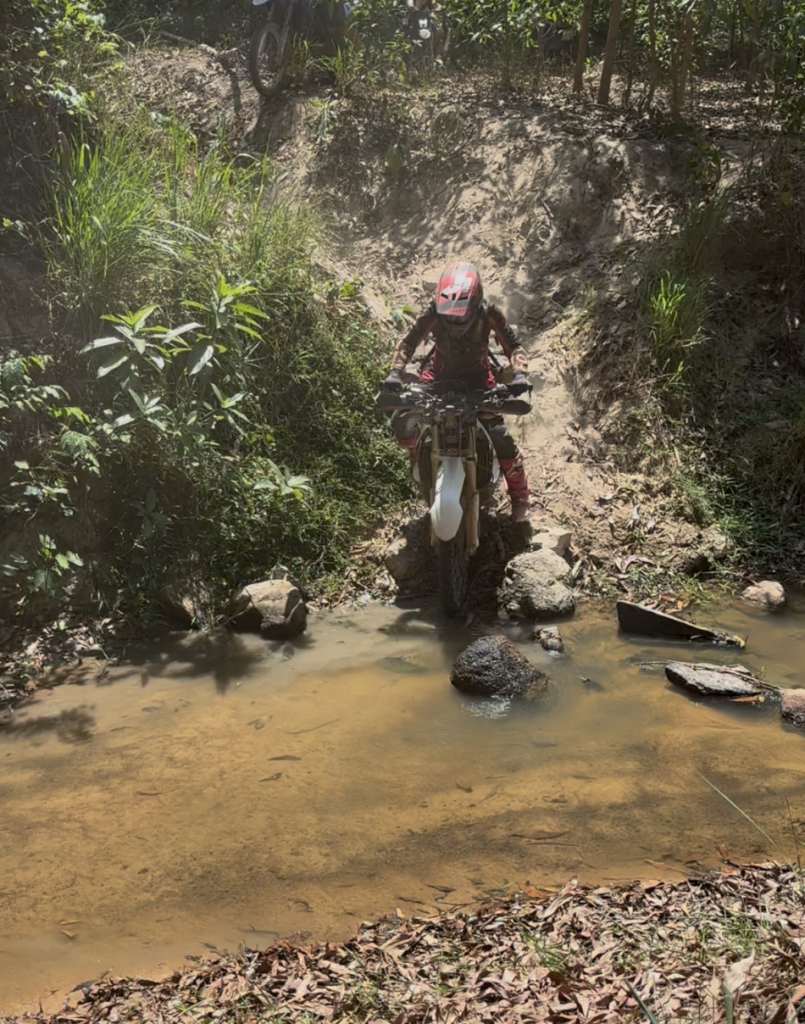
And the third picture is from April when the water level was the lowest, after months of heat and almost no rain. Crossing was a piece of cake.
5 Comments